THIS PAGE IS TO COVER TOPICS OF SPATIAL DATA WHICH IS A KEY FOCUS OF THIS YEAR’S EVENT. Our competition and sessions will focus on this area. If you look at our timetable you will notice this. Therefore the purpose of this page is to help you prepare in advance with some key concepts with regard to spatial data.
Spatial data is any data that directly or indirectly refers to a specific geographical area or location. Spatial data refers to more than just a spatial component on a map. There are two types. Geometric data – this is data that is mapped on a two-dimensional flat surface, e.g. floor plans. Google maps is an application that uses geometric data to facilitate navigation. Geographic data is a spatial data type that is mapped around a sphere, usually the earth. Geographic data uses the longitude and latitude relationship to a specific object or location.
Georeferencing and geocoding are important aspects of geospatial analysis. Both refer to fitting data into the real world using coordinates. Georeferencing assigns coordinates to vectors and rasters, and geocoding provides addresses and location descriptors.
You can read a good introduction to these concepts here.
Spatial Data Sources for Malawi:
- The Malawi Spatial Data Platform: http://www.masdap.mw/
- Department of Forestry Malawi: https://www.dof.gov.mw/resources/geospatial-data
Example: Suppose we want to analyse how many of the protected areas and forests are close to urban settlements.
Step 1. You should install QGIS. This is a free and open source program that helps you work with spatial data.
Step 2. Open QGIS and get familiar in broad terms with the interface. There are useful resources around to help you with that.
Step 3. In this example, we will be using the menu Layer -> Add Layer -> Add Vector Layer as we will add to visualise some vector datasets from Malawi.
Step 4. Go to the following page of the Department of Forestry in Malawi where you will find several spatial data files. Download Rivers.zip and ‘Forest Reserves.zip‘ and ‘Malawi All Protected Areas.zip’. Save and extract all zips folders on your PC.
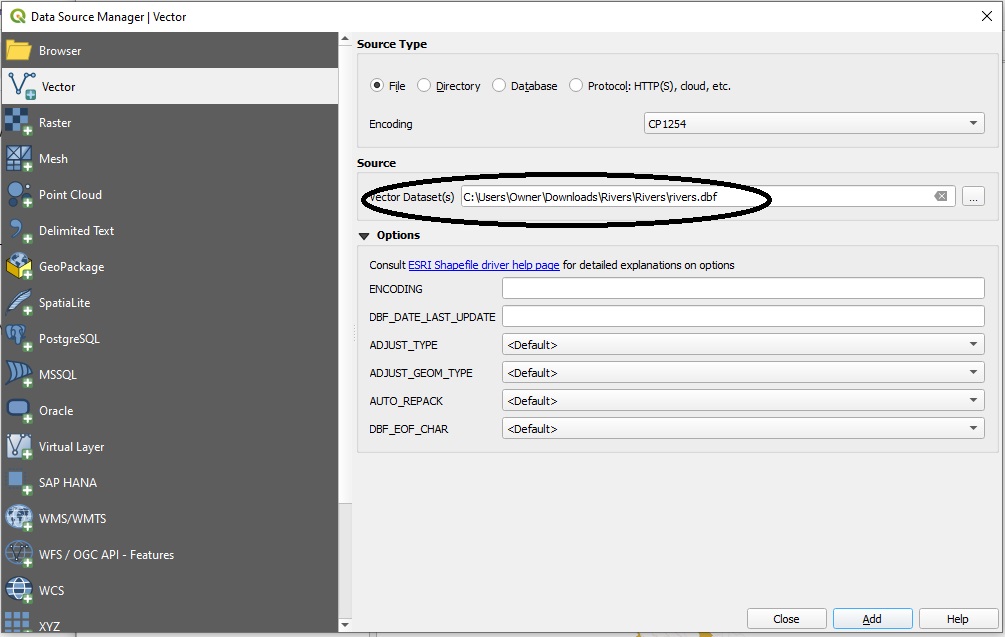
Step 5. Go to QGIS and open all the layers from the archives one by one. You are interested in importing all files with the extension “.dbf”, this is a file that saves spatial attributes of the data in a tabular format. Here is how the interface looks after you go to Layer -> Add Layer -> Add Vector Layer and then you will import the respective .dbf file from the Rivers.zip archive.:
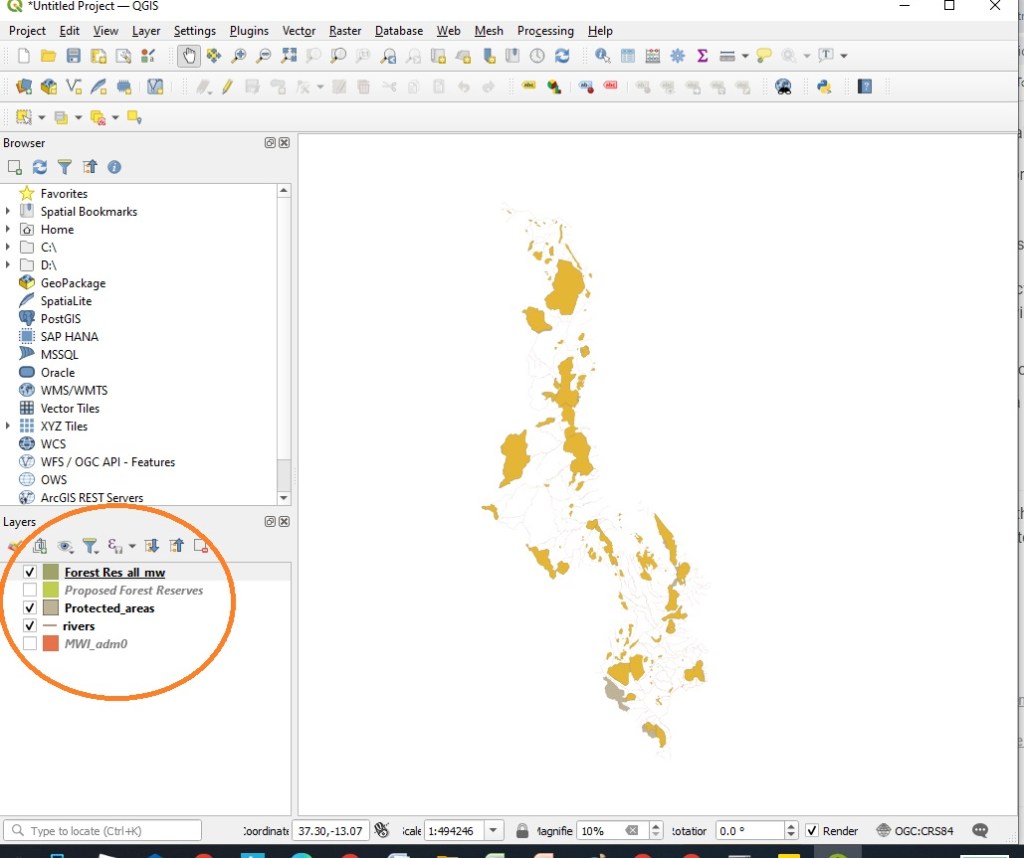
Step 6. You will see the following visual map composed of all the layers.
Step 7. We now need some spatial data pertaining to urban areas or heavily populated areas. We can get this from Malawi Spatial Data Platform here. We will download the zipped ShapeFile, Urban.zip.
Step 8. We import the layer from Urban.zip as shown in the previous steps.
This is now what you should see (showing only a part of the whole map). The spots in green are the urban areas.
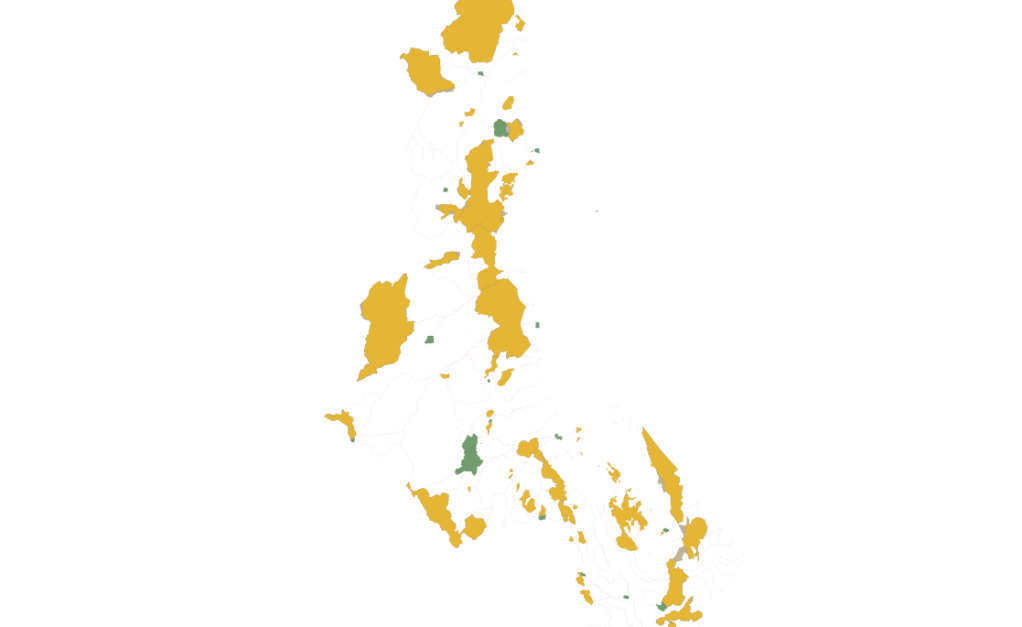
Or course this can be useful to a trained eye who knows the geography of Malawi. However to really make use of this spatial data we need to analyse the numbers further.
This can be discussed in the next example.
